PS/HI Note 96-13 (Tech.)
The Laser Ion Source (LIS) aims to provide beam for acceleration by a four-rod RFQ during the summer of 1996. One of the most important parameters of the source output is the transverse emittance.
During 1995 this emittance was measured at the source exit using a pepper-pot, multi-channel plate (MCP) and CCD camera arrangement. A thorough description of this scheme is given in [1]. These measurements were taken with a target to extraction distance of 620 mm and electrode apertures of 15 mm diameter, giving a total extraction current of ~30 mA (all charge-states averaged over the high charge state pulse).
For injection into the RFQ, the total current extracted should be of the order of 90 mA, so a drift target to extraction distance of 900 mm was chosen with electrode apertures of 30 mm diameter. In this note, measurements of the emittance are given for these conditions.
Other improvements made to the emittance measurement scheme included
using a fast high voltage transistor switch to apply the gating
voltage to the MCP and data treatment for the calculation an RMS
emittance. Furthermore, measurements of the emittance were made
for the following conditions:-
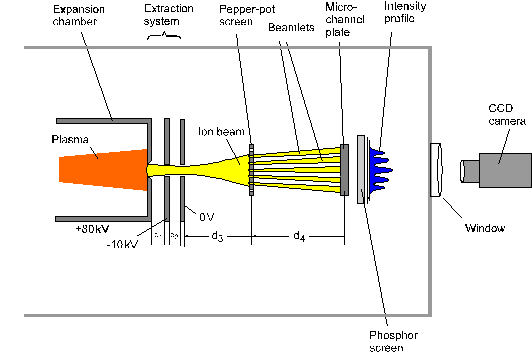
The full scheme for the measurements is shown in Figure 1.
The distances were d1=30 mm, d2=15 mm,
d3= 79 mm, d4=65 mm and the
electrodes were 7 mm thick. The target to positive electrode
distance was 0.9 m. The CCD camera used a zoom lens to image
the phosphor screen. A typical resolution of 4 pixels per mm was
achieved with the CCD camera

From images integrated in the horizontal direction, the peaks were sufficiently separated to allow the calculation of an RMS emittance. A small error due to the loss of the tails of the peaks, results in a reduction of the calculated emittance of ~10%.
A typical image of the beam after the pepper-pot is shown in Figure 2 and the associated phase space diagram for the horizontal plane in Figure 3. These measurements were made with target potential (Vp)=+79 kV, intermediate electrode potential (Vin)=-10 kV with the distances shown in Figure 1. The resulting emittance was 280 mm.mrad for 4rms. The MCP was gated from 3.0 to 7.2 ms. The calculation of the proportion of the particles lying within an ellipse with the calculated Twiss parameters and emittances of different RMS sizes, shows that approximately 85% of the beam lies within the 4rms emittance.
Figure 4 shows the beam profile calculated from the pepper-pot
image, showing that a Gaussian profile is a good approximation.
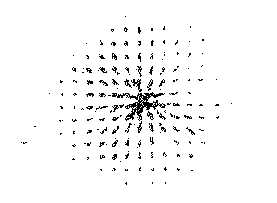
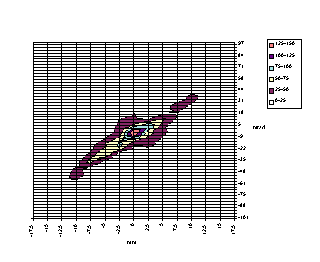

Figure 3.
Left - Typical measured emittance. e=280 mm.rad
(horizontal 4rms). Ions extracted at 79 kV. Average current
of 66 mA was extracted (with some electron enhancement).
Right - Fraction of particles inside ideal emittance ellipses
formed from Twiss parameters and different numbers of RMS emittances.

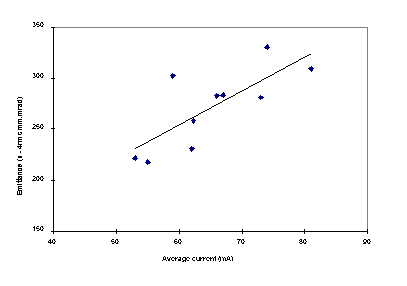
Under constant settings for the LIS, there is still a considerable change in the shot to shot characteristics of the beam. Measurements were made of the emittance under constant conditions with a MCP gated from 3.0 ms to 7.2 ms. The emittances are shown plotted against current in Figure 5. The current corresponds to the average value measured from 3 ms to 8 ms. The current is enhanced by electron emission from the pepper-pot.
There is a strong relationship between the extracted current and the measured emittance.
A time dependence of the phase space of the beam has already been measured in [1], where it was shown that emittance was approximately constant during the pulse, but the orientation of a phase space ellipse drawn around the distribution changed during the pulse.
Using the minimum possible gate on the MCP (approximately 1ms), different time delays could be used (from the laser pulse) and a time scan made through the high charge state pulse.
The results of 65 measurements (5 at each time delay) are shown
in Figure 6. The extraction conditions were Vp=+79 kV
and Vin=-10 kV.
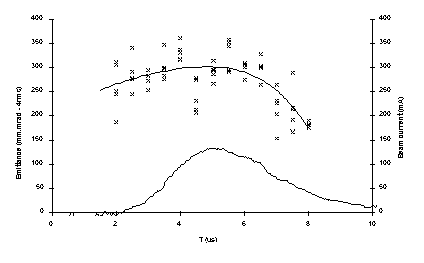
The average emittance varies from approximately 180 to 300 mm.mrad during the pulse. For comparison, a typical extracted current pulse is shown, measured in a Faraday cup 2.4 cm after the ground extraction electrode (cup has 3 cm input aperture).
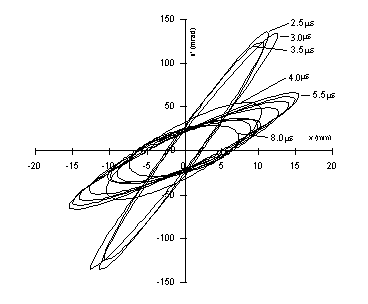
Figure 7 shows an emittance ellipse constructed from the average
emittance and Twiss parameters from the 5 shots at each time delay.
The most obvious feature is the sudden jump in position of the
ellipse from 3.5 to 4.0 ms delay.
Unfortunately, this also corresponds to a time when the ion source
was stopped for 2 hours. The ellipses overlap each other well
enough (within the two groups) to suggest that there should not
be a large increase in emittance when integrating through the
whole pulse.
Measurements of emittance at different positive extraction potentials were given in [1] and showed that the emittance decreased up to 80 kV.
In Figure 8 are shown further measurements for the conditions detailed in Figure 1. Insufficient measurements were made to draw a conclusion as to where a minimum of the emittance may lie. At low voltages the current traces (measured from the current to the target chamber) suffered greatly from electron enhancement with a large proportion of the current hitting the extraction electrodes.

Following measurements of the charge state distribution during April 1996, the most intense charge state was found to be Ta20+. It was not possible to optimize the source for Ta16+, the lowest charge state that the RFQ can accelerate. For this charge state the positive extraction voltage should be set to ~59 kV. Changes in the design of the source to bring the extraction area to the end of the expansion tank, meant that the target to positive extraction electrode distance was increased to 1 m, producing a lower current at the source outlet. Under these conditions the ~65 mA extracted current is well matched to the extraction voltage (given by P=1-2x10⁻⁸ (z/A)1/2 [A/V3/2]).
The emittance was re-measured under these conditions using the
same apparatus shown in Figure 1, except that a P47 phosphor screen
was used in place of the MCP. The phosphor screen was positioned
97 mm after the pepper-pot. The average emittance and Twiss
parameters of 5 shots were e=225 mm.mrad (4
rms), a=-2.6, b=0.7
mm/mrad.
Emittance measurements have been performed on the Laser Ion Source under conditions closer to those required for the forthcoming RFQ experiment. The emittance value has been recorded as a function of the extracted current, the time in the current pulse and as a function of the target voltage.
[1] J. Collier, B. Goddard, G. Hall, A. Shumshurov, J. Tambini. Emittance measurements on the CERN Laser Ion Source, CERN PS/HI 95-07.